2023 report on disability in higher education
Published on January 20, 2024. Updated on February 18, 2024.
Abstract
Between March 2022 and June 2023, we surveyed students at 106 universities and asked respondents to answer questions about accessibility (Pillar I), inclusion (Pillar II), safety (Pillar III), and critical pedagogy (Pillar IV) on their campuses. The highest scoring university in this sample, Harvard University (136.3) only achieved less than 35% of the total possible 400 points. Private and public universities equally represented the top ten scoring universities, although private universities generally outperformed public universities on Pillars I, II, and III, while public universities performed better on Pillar IV. Harvard University was the only institution in the sample to score above the national average on all four Pillars. The mean national scores for each of the four Pillars were 16.0 (SD = 10.4), 12.7 (SD = 17.6), 5.1 (SD = 12.1), and 38.9 (SD = 18.7), respectively. When given the opportunity to answer an open-ended question about their experiences at university, accommodation was by far the topic that students had the most to write about, and mostly to convey adverse experiences with seeking support and feeling believed.
* Updates: Since the time this report was originally published on January 20, 2024, we have made several corrections and changes to the report. We have added additional text to some sections to better justify the metrics. We fixed Figures 2 and 5, which incorrectly compared scores by mean instead of median. (Note: Figures 7 and 9 compare scores by mean, which is as intended.) We corrected data for Yale University and UCLA, which slightly affected their scores. Our sincerest thanks to the students at Yale and UCLA who took the time to contact me to improve the accuracy of this report.
Acknowledgments
This project was made possible by the funding and support from the Emerge Fellowship, an opportunity provided by the Paul K. Longmore Institute on Disability to support early career scholar-activists developing projects that add new perspectives to disability studies and disability justice. In particular, I would like to thank Emily Beitiks for her mentorship and encouragement, and being a role model for grace and disability justice praxis. I would also like to thank Cavar Sarah for their critical work on this project in its early development, and Nicole Lee Schroeder for her early support for this project. And finally, my deepest gratitude to Neurodivergent-U’s advisory board members, who granted their expertise throughout the project’s continued development: Kendra McLaughlin, Nick Walker, Shira Collings, and stefanie lyn kaufman-mthimkhulu.
Background
Disabled students struggling with the many barriers, stigmas, and discrimination we encounter in academia can become a daunting and isolating experience, especially when we lack information to contextualize and process those experiences. This project was an attempt to identify those barriers, and recognize those universities working to remove them.
This project was motivated by my experiences as a student at Columbia University, and my belated realization that my struggles were connected to the struggles of other disabled students, and more broadly connected to many of the sociopolitical currents that are currently changing higher education. For example, the increased policing of neurodivergence and mental illness on college campuses is deeply connected with the growing fascism around the country, including attacks on LGBTQ rights and expression (ACLU 2023), attempts to shut down Diversity, Equity, and Inclusion (DEI) initiatives on university campuses (The Chronicle of Higher Education, n.d.), and efforts to ban teaching of critical race theory (UCLA School of Law, n.d.). Disability discrimination has been exacerbated in recent decades by the corporatization of higher education, which has produced a cutthroat culture in which students are “obsessing over career opportunities and grades” rather than fighting for equity, “breeding a community that sees each other as a hurdle to jump over to make it to the top” (Ling 2021). Disability discrimination is also inextricably linked to the not-so-far-distant histories of eugenics and systematic exclusion of disabled people from higher education prior to the ADA. Like all disabled activism, this project was born out of necessity, in recognition of the fact that only disabled voices can accurately articulate our own narratives, experiences, and needs, and the futures we want to create for ourselves, including how we want technology to work for us (Center for Genetics and Society 2022), and how we want to be represented (Petersen 2023).
Other attempts to survey and rate aspects of disability inclusion and accessibility in higher education have been made in recent years, indicating that movements like disability justice and disability visibility (Wong 2020) are making headway. In 2021, about a year after Cavar Sarah and I announced our outline for this project on social media, The Johns Hopkins University Disability Health Research Center (2021) published the University Disability Inclusion Dashboard, which featured their own university rankings based on four categories: physical and remote accessibility; inclusion; accommodation process and procedures; and grievance policies. Their sample size was fifty universities, and their ratings were based on publicly available data collected between June and November, 2021. The primary limitation of their study was that it focused entirely on measuring administrative policy and institutional capacity, as opposed to surveying disabled students’ actual experiences at college.
Other organizations have similarly published assessments focusing on specific aspects of disability. In 2020, for example, New Mobility magazine identified the twenty most wheelchair-friendly campuses in the United States. Surveys were sent to disability service offices at the top 400 universities, and respondents were asked 45 questions pertaining to wheelchair accessibility, adaptive sports, inclusion in Greek life, and more. For the campuses with the top raw scores based on the survey responses, New Mobility (2020) “sent wheelchair-using reporters to perform personal tours and inspections and interview students and staff on several campuses.” Despite this rigorous vetting, however, New Mobility received feedback from students who disputed some of its findings at the campuses that it recognized as most inclusive and accessible. The results of the present study, as well, contradict several of the findings in New Mobility’s report, likely because their survey relied on self-reporting from university administrators, while our survey centered student voices.
In 2018, the Ruderman Family Foundation published “The Ruderman White Paper on Mental Health in the Ivy League.” For this novel study, Miriam Heyman developed a rating system to assess the eight Ivy League universities on their policies pertaining to students who take leaves of absence for reasons related to mental illness. The paper has been widely cited in mainstream press, and has contributed significantly to focusing much needed media and public attention in recent years to the punitive and often harmful ways that university administrations respond to students in crisis. The strength and weakness of this paper is that it “focuses on one aspect of the mental health climate on college campuses” (Heyman 2018), which is a resultant of multiple political, economic, and social factors affecting the culture of higher education. Another weakness is its small convenience sample of eight highly elite campuses, which are not representative of the US college student population.
Introduction
Between March 2022 and June 2023, utilizing a combination of original survey data and publicly available data, we gathered information related to fifteen precisely defined metrics based on four Pillars: support & accessibility; inclusion; safety; and critical pedagogy.
These metrics are not exhaustive in representing the many types of barriers and discrimination that disabled people experience in higher education. Although we aimed to be expansive, we were constrained by the practicalities of survey measurement and limited resources. We therefore designed a survey that was independent as much as possible of the number of respondents, by choosing metrics that did not rely on subjective assessments and the law of large numbers. With the metrics we chose, a single respondent could provide an accurate assessment of accessibility on their campus, e.g. either lectures are recorded, or not; either documentation for provisional accommodations is required, or not; etc.
As much as possible, however, multiple respondents for each campus were recruited to improve accuracy as well as obtain more qualitative data on student experiences. These experiences, quoted from students in their exact words, are included in this report and on the website, but do not impact the scores, except for one metric asking students to report incidents of ableism on campus. Our goal with this project was not to create a scientifically valid instrument, but rather a medium to validate the truths of students' lived experiences, one that is often erased by those who either presume to speak for us or actively silence us. This project is part experiment, part activism, and part work of art.
You won't find many academic papers cited in this report, and that was intentional. Disabled people know and understand our needs best. We are the experts on ourselves. This research project and its results are very much informed and shaped by lived experience. Research led by people with lived experience is particularly important in order to break a long and entrenched pattern of academicians and medical experts defining what quality of life means for disabled people, often ignoring or speaking over the voices of disabled people when we express our needs and identities in ways that don't fit within a medical or pathologizing frame of disability.
Method
Our target sample was 102 universities representing the top public (or flagship) and private universities in each state, plus District of Columbia. This convenience sample was based on U.S. News & World Report Best Colleges 2021 rankings.
Because some states do not have top 200 nationally ranked private universities (Alaska, Arizona, Arkansas, Delaware, Hawaii, Idaho, Kansas, Kentucky, Maine, Michigan, Mississippi, Montana, Nevada, New Mexico, North Dakota, South Carolina, South Dakota, Vermont, Virginia, West Virginia, Wyoming), our target sample was reduced to 81 universities. District of Columbia does not have a nationally ranked public university, reducing the target sample further to 80 universities.
Small liberal arts colleges, HBCs, and community colleges were excluded from this analysis, though we hope to include these institutions in a future iteration of the survey. We also wanted to include institutions of higher education that specialize in serving disabled students, and reached out to students at Gallaudet University and Landmark College but did not receive any responses.
Survey invites were posted on online discussion sites and job sites, and participation was also solicited by emailing campus disability advocacy groups. University affiliation was confirmed by email verification. Participants were paid for completing the survey.
In total, we received 271 survey responses from students at 106 universities. Out of the 271 responses received, 22 responses were dropped for failing quality checks or, in one case, for pertaining to a completely online program. Quality checks included verifying responses about campus, which could be factchecked by internet research, as well as counting if a majority of the participant’s responses were “Don’t know” or not relevant to the questions being asked.
At the time of writing this report, we were missing data for 15 universities, which are hence excluded from this analysis.1 We did not receive survey data for Massachusetts Institute of Technology, the top-ranked private university in Massachusetts, and decided to substitute Harvard University (MA) in its place since these two universities are closely ranked. We were also missing survey data for five other universities: Georgetown University (DC), Emory University (GA), Duke University (NC), Dartmouth College (NH), and Princeton University (NJ). However, we were able to use publicly available data to complete evaluations for these campuses, which were therefore included in this analysis.
After filtering for the top-ranked private and public universities in each state (80 universities total) and accounting for universities with missing data (15 universities), the final sample was 65 universities comprising 238 individual survey responses and representing 47 states (including District of Columbia), 44 public universities, and 21 private universities. The average number of survey responses per institution was three and the median was two.
1 Samford University (AL), Drake University (IA), University of St. Thomas (MN), University of Missouri, Creighton University (NE), University of North Dakota, University of Tulsa (OK), Pacific University (OR), University of Rhode Island, Brigham Young University (UT), University of Utah, Gonzaga University (WA), West Virginia University, Marquette University (WI), and University of Wyoming
Results
Because each Pillar comprised a different number of metrics, we balanced the weight of each Pillar by normalizing each metric to 100 and calculating the average score of the components for each Pillar. Each Pillar therefore had a potential maximum value of 100 and a potential minimum of zero, and each contributed a quarter value of the total score, which was the sum of the scores for each Pillar. Overall results and individual scores for all universities can be found on the website. The rankings correspond to the scores presented in this report, except that the scores on the website are converted to a 1,400 point system, and the website includes additional universities not in this sample.
Note that the data used for these analyses may be outdated for some campuses at the time of writing this report. We have attempted, as best as possible, to include updated information in the text.
Pillar I: Support & Accessibility
Pillar I comprised six metrics. The first metric asked respondents, How much time do they have between consecutively scheduled classes? For the second metric, students were asked to recall the wait time for an initial appointment at their campus psychological counseling services center. The third metric asked, How many mental health service providers are on staff at the university's counseling and psychological services center? For the fourth metric, students were asked whether all campus buildings, including residence halls, are physically accessible to people who use wheelchairs or other mobility devices. The fifth metric concerned remote access, and asked students if class session recordings are readily available for their lecture courses. The sixth metric asked if students are required to provide documentation of disability to qualify for receiving initial accommodations.
Comparing scores on Pillar I across the four Census Bureau regions of the United States, universities in the Northeast scored best (Mdn = 20.83, M = 19.90, SD = 10.39), followed by Southern universities (Mdn = 19.17, M = 17.20, SD = 11.41), then universities in the West (Mdn = 11.67, M = 14.49, 10.26) and Midwest (Mdn = 11.67, M = 10.95, SD = 7.27). Private universities (Mdn = 21.67, M = 21.27, SD = 10.38) outscored public universities (Mdn = 11.67, M = 13.45, SD = 9.57) nationally and across all four regions. Note that since the distribution of scores for Pillar I was right skewed (Figure 1), we compared regional scores based on their median values (Figure 2 below).
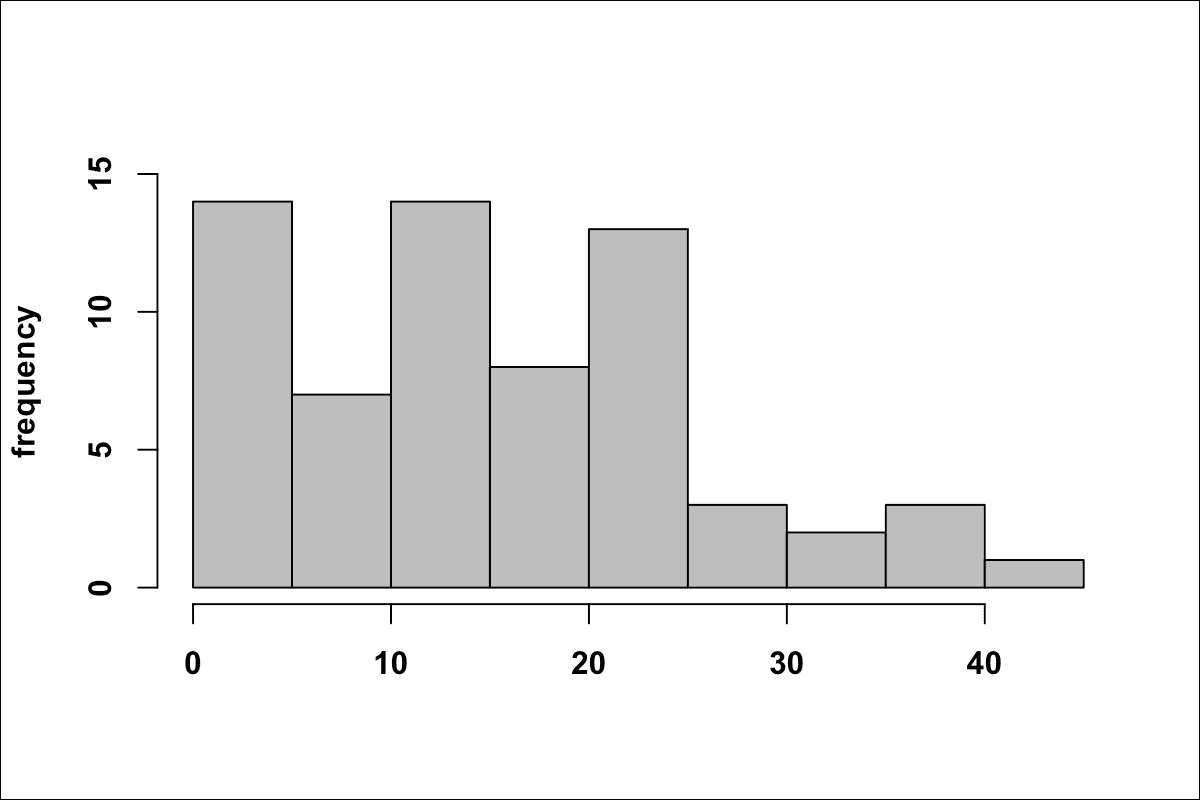
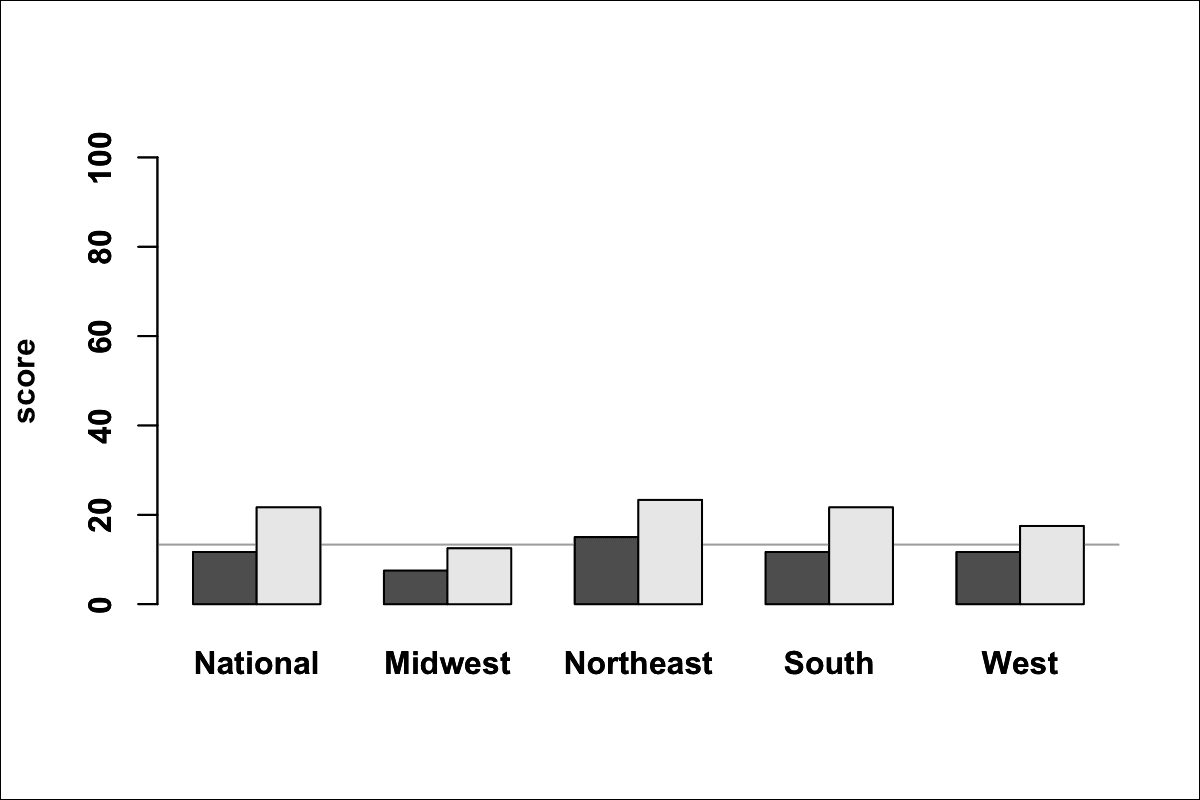
For the entire sample, the average score for Pillar I was 15.97 out of 100, with standard deviation of 10.43. The median score was 13.33. The minimum score was 3.33 and the maximum score was 43.33 out of 100.
The universities that scored highest on Pillar 1 were:
| 1 | Duke University | 43.33 | |
| 2 | Brown University | 40.00 | |
| 2 | Dartmouth College | 40.00 | |
| 4 | University of Arkansas | 36.67 | |
| 5 | University of Alaska Fairbanks | 31.67 | |
| 5 | University of Colorado Boulder | 31.67 |
Time between classes: Most universities have set intervals between consecutively scheduled classes of 10, 15, or 20 minutes despite that, on many large campuses, walking from one end of campus to the other can take up to half an hour and perhaps longer for disabled students. A student at the University of Colorado Boulder explains, “It does take me longer to get to class and stuff because I take the elevator and need transportation to campus. The bus is crowded a lot so I either get a ride or take the scooters. Some buildings have stairs in front that take me a while to get up or go around the building to enter from an easier door.”
Only three universities in this sample (Duke University, Rutgers University-New Brunswick, and The University of Tennessee Knoxville) were reported to have scheduled time between classes of 20 minutes or longer. Thirty-nine of the 65 universities surveyed (60%) allowed only 10 minutes between classes. Some students reported having less than 5 minutes scheduled between classes.
Update: The Daily Princetonian, the student newspaper of Princeton University, reported in October, 2023 that the university is considering increasing the time between classes to 20 minutes. Princeton University currently allows only ten minutes between classes, which they acknowledge causes difficulty "for injured students, students with a disability, or students who are partaking in interdisciplinary courses which may take place all around campus" (Gabelnick 2023).
Wait time for initial counseling appointment: While many university counseling centers offer drop-in hours for urgent issues, students who would prefer to get established with a regular counselor may also find it difficult to visit during drop-in hours.
Only one university (University of Arkansas) was reported to have wait times of 1-2 days for an initial counseling appointment. Five universities had wait times of less than one week: Brown University, Dartmouth College, Duke University, The University of Chicago, and University of Miami. Fifty-two of the 65 universities surveyed had wait times of more than two weeks, and it was not uncommon for students to report wait times of several months in order to get an initial meeting with a counselor. Some students reported having to wait until the following semester. A student at Yale University responded that the wait time was “6 months or more for psychological counseling services through the student healthcare system” though another Yale student told us that “it really depends on the time you request an intake,” and reported variable wait times anywhere between three days to three months.
Number of counselors on staff per thousand students: One in five students will experience mental health issues in college. That’s 200 out of 1000 students. So if a therapist meets with 20 students per week, then a university would need 10 therapists to meet weekly with students seeking services. However, many universities cap services at 8-12 sessions per semester or schedule regular sessions only every other week. If a semester is 16 weeks, then a university that limits counseling services would require five therapists per 1000 students. This is how we determined that five therapists per thousand students is the absolute minimum required to meet student demand for therapy.
Only four universities (Columbia University, Princeton University, Vanderbilt University, and Yale University) had five or more counselors on staff per thousand students, yet it’s notable that three of those four universities still had reported wait times of more than two weeks for an initial counseling appointment. Unfortunately, many universities are forcing students to seek counseling off campus or to entirely forego counseling for lack of convenience.
At Clemson University, a student responded that the wait is “6-8 weeks to see a counselor.” They added, “It’s absurd and many students are suffering due to lack of mental health resources. There is also a lack of off campus mental health providers so it’s extremely difficult to see anyone at all.” A graduate student at Pacific University who was turned away from their student health center writes that, “I was not given recommendations of where to go, and when I requested those recommendations I received a list of providers with GIGANTIC wait times. So I had to find someone on my own and it took a month of searching.”
A student at the University of Tennessee, Knoxville criticized the lack of staffing at the counseling center, writing “At UTK, student counseling services are very (VERY) overwhelmed, with wait times spanning months, even for those in crisis. My university has the money to onboard more qualified counseling staff, but decided on a multi-million stadium renovation instead.”
Increasingly, universities have been offering online therapy services through third-party providers (Curiel 2022; Milkowski 2022).
Buildings accessibility: This metric indicates whether a campus is completely accessible for people using mobility devices. Only three campuses in this sample (University of Colorado Boulder, University of Maine, and University of Mississippi) were reported to be fully accessible. But it’s also important to mention here that while buildings on campus may be “technically accessible,” they may not be “practically accessible” for students. What this means is that many students reported accessible entrances being located in out-of-the-way areas, inconvenient hours for transportation services, or having to pass through several connected buildings in order to get to the actual building in which their classes were located.
Students at many campuses also report elevators and automatic door openers that are frequently out of service. A student at the University of California, Los Angeles said that “The elevator in my building was broken for 3 years despite multiple complaints.” A student at the University of Notre Dame adds that, on their campus, “Even some of the elevators look like a cage and are not safe. Some of our dorms don’t even have Braille markings or accessible bathroom stalls.” At the University of North Carolina at Chapel Hill, two students who use wheelchairs were stuck on the upper floor of a residence hall for 32 hours when the elevator malfunctioned last year (Reilly and Egan 2023).
Because accessibility is vital to students’ health, wellbeing, and success, some students have taken it upon themselves to map or audit the accessibility of their campuses. In recent years, students at campuses including Princeton University (Huang and Navaratnam-Tomayko 2023), The George Washington University, and University of Notre Dame have conducted independent accessibility audits of their campuses.
One issue that has been receiving increasing attention in recent years is the lack of sensory-friendly spaces on most university campuses, as the overcrowding, bustle, and noise on many campuses can present significant challenges for neurodivergent students. At the College of William & Mary, a student explained to us, “There are very few neurodivergent-friendly places on campus, and both the student body and administration have a general lack of awareness.” A student writes in the UCLA student newspaper that “Nearly every space on campus where students are allowed is filled to the brim with exorbitant sensory stimuli: the lecture halls, the dorms, the dining halls, the restaurants, the gyms and the libraries. There is almost nowhere for students with sensory issues to escape to… This can impact their academic performance, mental health and overall well-being” (Hirsch 2023).
Remote accessibility: Students reported that hybrid and remote learning options have been increasingly pulled back this year. A student at the University of Notre Dame told us that the administration “said in 2021 that Zoom classes were a fundamental alteration of a course and so they wouldn’t count as a reasonable accommodation. Every professor was told that they weren’t allowed to offer Zoom classes if a student approached them about it.” However, the student adds, “Other professors record every class and publish them because they think the rule is silly.”
An autistic student at the University of Connecticut shares the following: “when i was a freshman, i was too afraid to fill out any forms on my disability (being on the spectrum of autism). i wouldn’t even tell my teachers because i didn’t want to be stigmatized for something i can’t control. that being said, i wished all teachers would teach and share their knowledge/documents (like slides and recordings) as if there are students with disabilities in each classroom whom are too afraid to disclose them.”
Only two universities in this sample (Brown University and University of Alaska Fairbanks) are still reportedly offering remote learning options for large lecture classes, although twelve universities were reported to have remote options, including lecture recordings, available as accommodations.
Update: The California Aggie, the student newspaper of the University of California, Davis, reports that the student government is conducting a survey to gauge student and faculty attitudes on mandatory lecture recordings. In addition to providing more accessible options for disabled students, the newspaper reports that recorded lectures can benefit the entire student population by allowing more flexibility for students when they’re having “bad mental health days” or don’t have transportation to campus (Freeman 2023).
Documentation for accommodations: Because of the amount of documentation required to receive accommodations, and because many students become disabled at college, where they are exposed to unfamiliar environments and social situations, it seems reasonable that universities should allow students provisional accommodations, provided they are making progress towards obtaining documentation (or have received prior diagnoses).
It can also be difficult to get an appointment for an evaluation for multiple reasons, including cost, time, and individual capacity. A student at the University of Virginia wrote that, “UVA tries hard to be accessible but getting accommodations can be a hassle especially if you’ve never had the ability to be formally evaluated because of financial/insurance reasons.” And a student at Vanderbilt University writes, “I was diagnosed with ADHD by a previous therapist before I moved for school. The school accepted that diagnosis for the sake of classroom accommodations. However, I have been considering starting medication, but in order to do that I need a more rigorous ADHD testing done. This costs hundreds of dollars. There is a fund to help with travel and things surrounding medical attention but it requires pre-approval and you can’t use the money towards copays. The school does free ADHD testing but the waitlist is very long. They clearly told me not to expect to get off the waitlist within the year. The demand is just too high.”
A student at Stanford University told us that, “Experiences with both campus counseling and accommodations office required lengthy wait times and lots of paperwork, among other things -- all what I was not in a state to do at the time and was part of exactly what I needed help with at the time. Students are assumed ‘normal’ and ‘functional’ and need to ‘prove’ otherwise, and that burden can feel very heavy.”
A student at Harvard University echoed these thoughts, writing that “When you struggle with depression, you don’t always have the individual capacity or bandwidth to advocate for yourself, not to mention a sense of proactivity to pursue the help that you need. That’s just not how depression works, and Harvard has a large community of depressed students.”
Currently, only four universities in this sample are reported to offer provisional accommodations: Tulane University, University of Idaho, University of Michigan-Ann Arbor, and University of Oregon. At the University of Idaho, which seemed to offer the most progressive and flexible policies for students, accommodations can be provided for two semesters without documentation. A staff member at University of Idaho’s Center for Disability Access and Resources (CDAR) explained to us that the primary reason for the grace period is because the wait time to get an Autism/ADHD evaluation can be several months. University of Idaho also grants provisional accommodations for psych disabilities though “students have to demonstrate that they are in treatment and require accommodation.”
The risk of many students unnecessarily struggling because of unmet needs far outweighs the risk of some students possibly gaming the system. At Purdue University, a student had to self-advocate after being denied accommodations, which can lead to fraught interactions with professors. They write, “I tried to request accommodations through the Disability Resource Center but was told that I had access to enough tools and services that they weren’t necessary. I ended up having to communicate one on one with instructors and disclose my mental health issues to get extensions on projects.” A student at Stanford University had similar experiences, writing that “Professors and supervisors press more with questions asking for a diagnosis when I request accommodations or let them know about my preferred ways of working or communicating.”
Unfortunately, even when students obtain official accommodations through the proper channels, another barrier they might encounter is from professors who refuse to work with their accommodations. A Harvard student tells us, “It's at my professor's discretion to decide how to apply my accommodations, which a lot of the time results in me receiving little to no aid by having those accommodations in the first place.” An engineering student at Northwestern University adds, “There was always a general ‘lack of believing in’ any non-physical disabilities or conditions, in my program. It seems to be improving with a younger set of professors coming through but is still far from comfortable.”
A student at the College of William & Mary corroborates all the above, adding, “Our department for disability services makes getting accommodations incredibly difficult, time-consuming, and unfriendly. In addition to this, professors are generally cold towards accommodations and often argue with students until explicitly told by the school to abide.”
Pillar II: Inclusion
Pillar II comprised two metrics. The metric for DEI training asked respondents if there is required diversity and inclusivity training for faculty, staff, and students, and whether training includes recognition of neurodivergence and disability. The metric for peer support asked students to identify the types of groups on campus that provide support for disabled students, including Disability Cultural Centers, mental health-focused peer support groups, and mutual aid networks. Campus advocacy organizations and clubs were generally excluded from this metric.
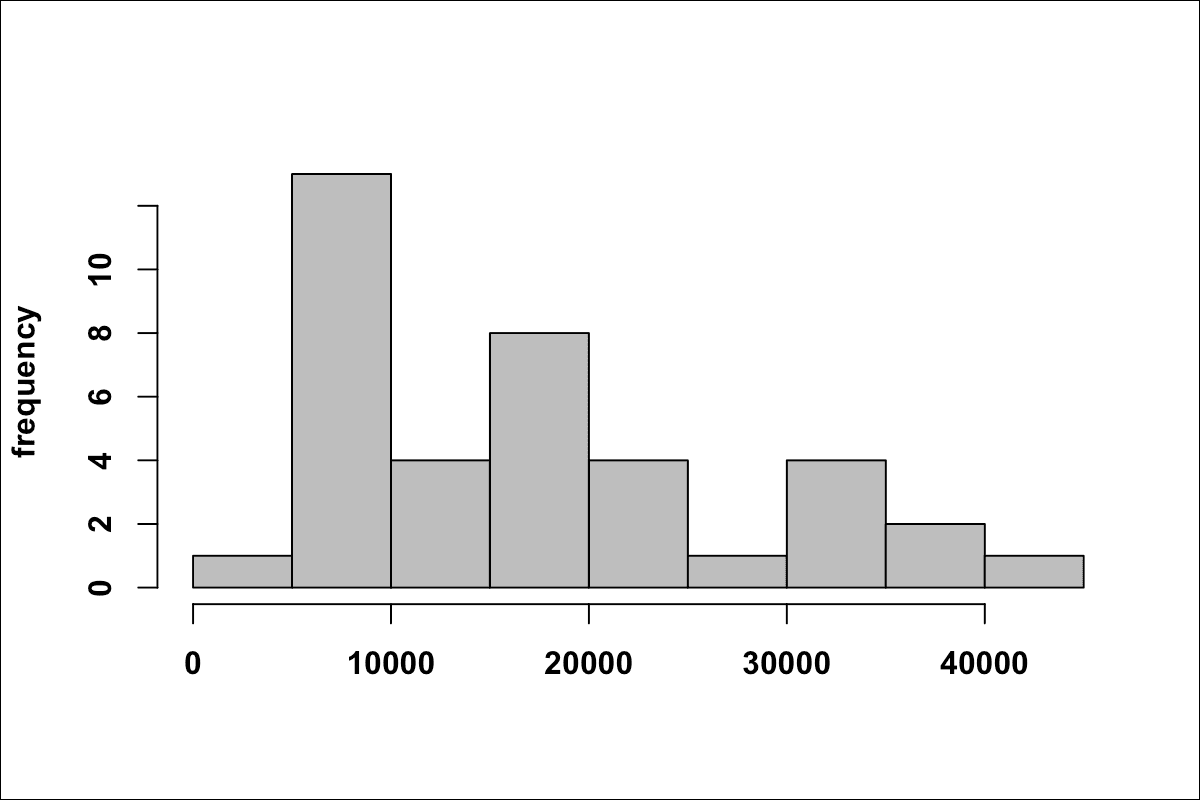
The distribution of scores for Pillar II was right skewed (Figure 4). Comparing median scores on Pillar II across the four regions of the United States, universities in the Northeast scored highest (Mdn = 12.50, M = 11.72, SD = 10.67), followed by Southern universities (Mdn = 6.25, M = 10.23, SD = 15.25), and lastly, Midwestern (Mdn = 0.00, M = 16.96, SD = 26.22) and Western universities (Mdn = 0.00, M = 13.46, SD = 18.01). Private universities (Mdn = 12.50, M = 19.64, SD = 18.36) outscored public universities (Mdn = 0.00, M = 9.38, SD = 16.43) nationally and across all four regions (Figure 5 below).
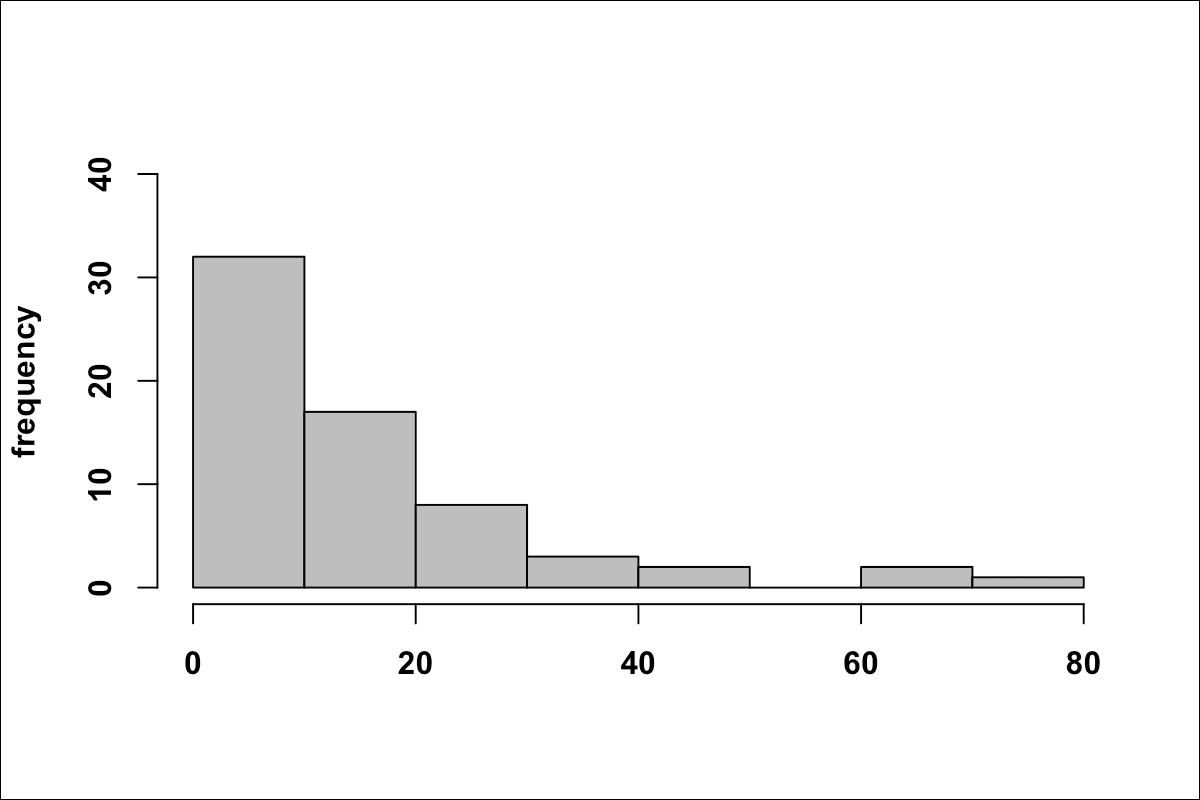
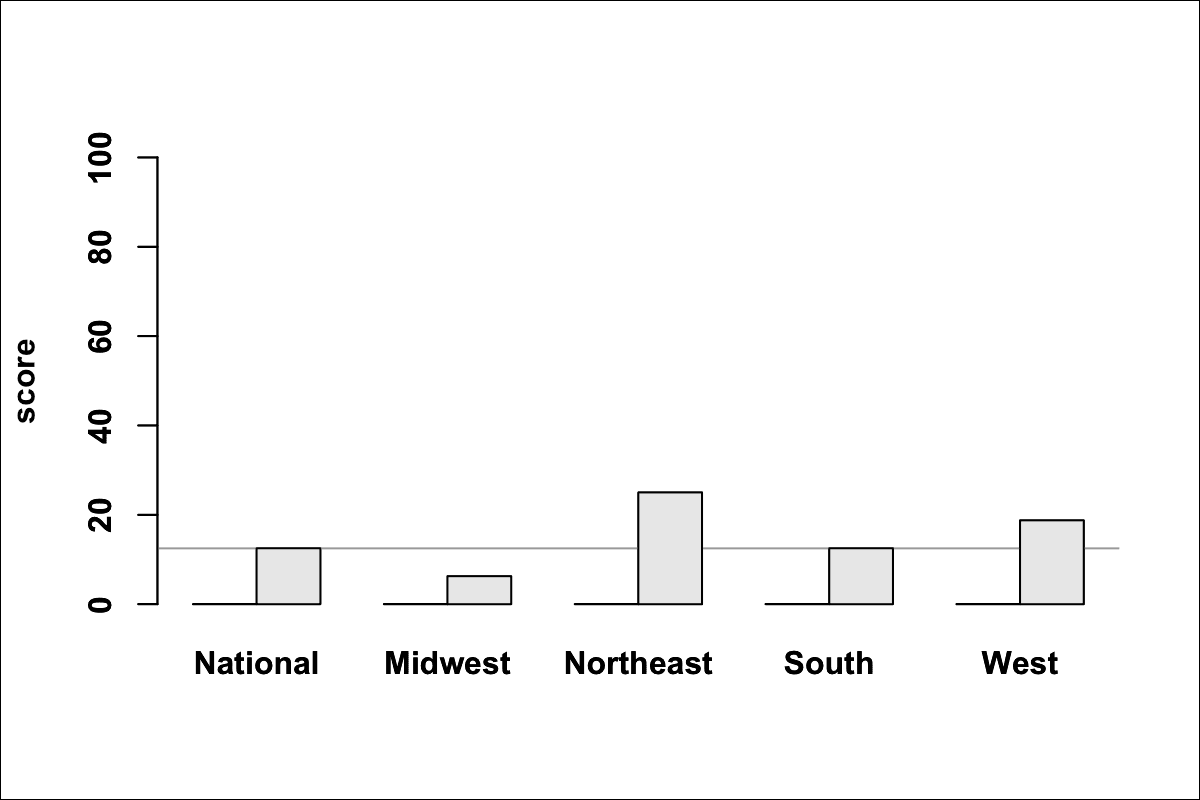
The average score for Pillar II for all universities in our sample was 12.69 out of 100 (SD = 19.18), and the median was 12.50. The minimum score was 0.00 and the maximum was 75.00.
The universities that scored highest on Pillar II were:
| 1 | University of Minnesota Twin Cities | 75.0 | |
| 2 | Johns Hopkins University | 62.5 | |
| 2 | The University of Chicago | 62.5 | |
| 4 | University of Idaho | 50.0 | |
| 4 | University of Wisconsin–Madison | 50.0 |
Mandatory DEI training: Only four universities in this sample were reported to have mandatory DEI training that includes disability and/or neurodiversity in their content. Those universities are Johns Hopkins University, The University of Chicago, University of Idaho, and University of Minnesota Twin Cities.
Among the ten campuses that comprise the University of California, one of the largest and most prestigious public university systems in the country, there is no mandated training on disability and ableism for faculty and staff (Mouly 2022). A student at Berkeley shared with us that, “I have accommodations but because my disability is a mood disorder it’s hard for teachers to sometimes understand what I go through. Teaching Staff should be trained to better understand what the different disabilities are their students may have.”
Including disability and neurodiversity in DEI training can also minimize the microaggressions that disabled students experience frequently in academic spaces. For example, a student at Georgia Tech writes that, “One of my professors wrote on his lecture slides that ‘normal’ students would take the exam in a specific room while ‘ODS’ (office of disability services) students would go to another location.”
Peer support: Peer support in higher education is both an established concept as well as a novel idea on many campuses. Harvard University, for example, has been running Room 13, “a confidential, non-judgmental, non-directive peer counseling service for Harvard undergraduates” since 1971. Other forms of peer support include mutual aid and Disability Cultural Centers (DCCs). Eighteen DCCs have now been established at university and college campuses across the US, according to the University of Illinois Chicago, and thirteen more are currently in the planning stages, including at University of Maryland. Many mutual aid groups, on the other hand, which were active during the height of the COVID pandemic, have since demobilized. We still often find operational mutual aid groups on campuses where unionizing campaigns are active or graduate student unions are established, however.
The University of Wisconsin–Madison is the only campus that currently offers all three types of peer support.
In addition to the much-recognized fact that many disabled students will leave higher education without a degree, there is an under-discussed reality that many disabled students also return to higher education as nontraditional, older students. For disabled students, this often exposes them to additional discrimination based on age and socioeconomic status, and also presents challenges for inclusion. For example, a student at University of California, Berkeley, told us that the peer support group on campus “wouldn’t let me join because I’m 34. I wanted to join the grad students because they were closer to my age. Unfortunately was not able to find a good time because they all run during the day time.”
Update: The Georgetown University student newspaper reports that a new Disability Cultural Center was opened in the fall of 2023 (Young 2023).
Pillar III: Safety
Pillar III comprised three metrics. The first metric asked whether students experienced ableism, discrimination, or harassment, or witnessed stigmatizing language on campus. The second metric noted if police are involved in responding to student mental health crises. For the third metric, we noted whether universities are using Students of Concern or CARE reporting systems to monitor students’ behaviors. A higher score on each of these binary metrics in Pillar III indicates the absence of one of these negative indicators of student safety.
Pillar III scores were bimodally distributed with scores occurring only at the minimum and maximum values of zero and 33.33 (the maximum possible value was 100) (Figure 6). Comparing regional scores for Pillar III by mean, universities in the Northeast scored highest (Mdn = 0.00, M = 12.50, SD = 16.67), followed by Midwestern universities (Mdn = 0.00, M = 7.14, SD = 14.19), then Western universities (Mdn = 0.00, M = 2.56, SD = 9.25), and lastly, Southern universities (Mdn = 0.00, M = 0.00, SD = 0.00). Private universities (Mdn = 0.00, M = 9.52, SD = 15.43) outscored public universities (Mdn = 0.00, M = 3.03, SD = 9.69) nationally, and in the Midwest and Northeast. Public universities outscored private universities in the West (Figure 7).
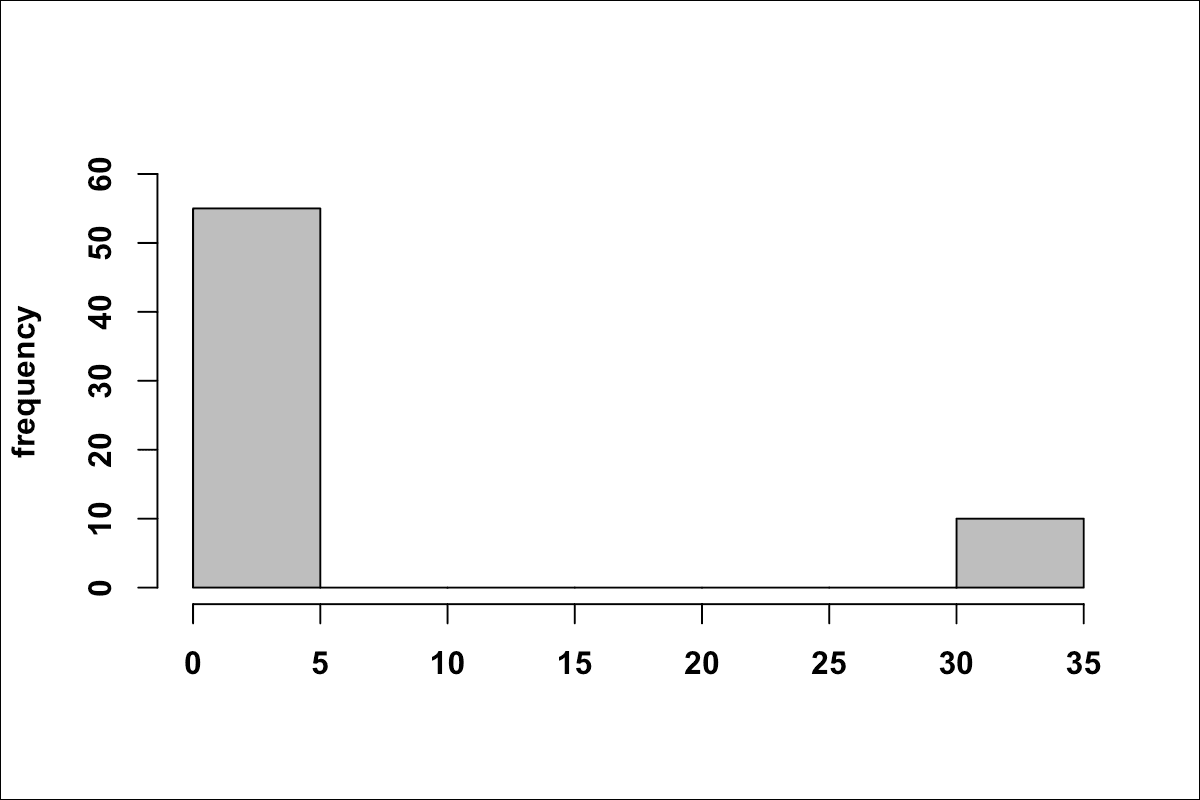
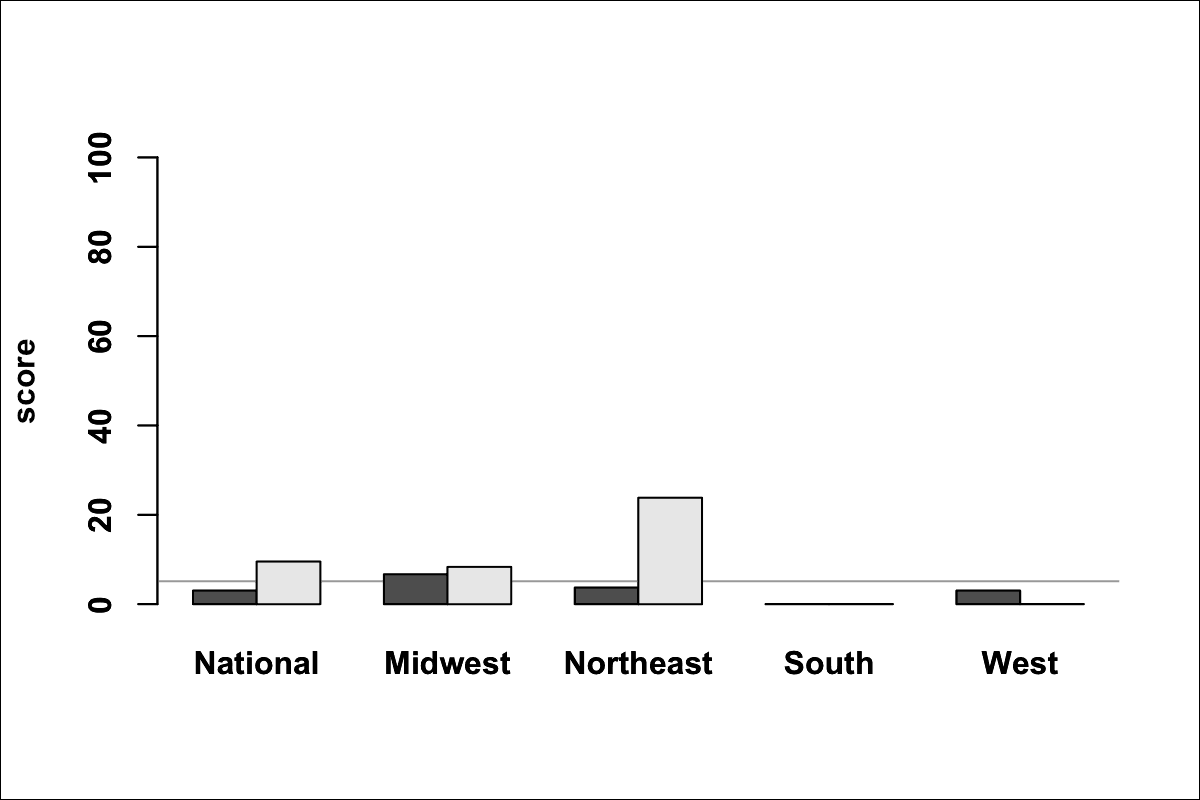
The average score for Pillar III for all universities in our sample was 5.13 out of 100 (SD = 12.12), and the median was 0.00. The minimum score was 0.00 and the maximum was 33.33. Ten universities scored 33.33.
Experiences of ableism: Instances of ableism and discrimination were experienced at every university, either reported in survey responses or in student newspapers. While this does not imply that every disabled student experiences discrimination at university, the results indicate that many students may be quietly struggling with these experiences on campus. Part of this may have to do with the “survival of the fittest” culture of academia, which is completely at odds with efforts to destigmatize and support student mental health. As a student at University of Pennsylvania explained to us, “The culture within the school is partly manufactured by many of the professors (particularly outside of the humanities) with a ‘sink-or-swim’ mentality where if you need help for any reason, that’s a sign of weakness. The word at UPenn for trying to pretend like everything’s fine when you’re deeply struggling is ‘Penn Face’ and implies that everyone is deeply struggling but must pretend like they’re alright.”
At Columbia University, a student related how this culture can become toxic for disabled students, writing “I get told a lot how lucky I must be to receive accommodations and how much they wish they had extra time for tests too. People make fun of those who have visible disabilities all the time. Or call themselves ADHD when they’re busy or excited.”
Disabled students frequently encounter casual discrimination from administration and faculty. For example, a student at Case Western Reserve University tells us, “The president of our school once said to the entire student council that if people needed disability related accommodations then they should transfer because ‘there were other schools built for those kinds of people.’ Because universities are increasingly managed like corporations (Rossi 2014), retaliation is also not uncommon and can prevent disabled students from feeling safe to openly discuss their adverse experiences. The same student writes, “When I raised a complaint with the administration about being denied an accommodation, the admin had one of my classrooms moved to the fourth floor of a grandfathered building. I am a wheelchair user.”
Neurodivergent students and students with mental illness have faced particularly punitive responses from university administrators in recent years. A student at the University of Florida told us that “Multiple students in my department, as well as faculty, have expressed attitudes of dismissal or scorn for neurodivergent identities and the complex struggles that come with them. It makes it difficult to figure out who, if anyone, I can disclose my chronic illness or ADHD to when I need accommodation or I am having a difficult time.” A student at UCLA shared, “I was forced to meet with housing about the ‘trauma I inflicted on other people’ after my suicide attempt -- I was socially isolated and didn’t know a single person in my building, so that’s not possible.”
At Dartmouth University, the student newspaper reported that a student receiving services at the counseling center for mental illness was told by his therapist that he did not belong at the university. The student was told, “You could definitely start looking at other schools, this place is not for you” (Gaylord and Feuerstein 2021). A student at Clemson University with bipolar disorder told us that their advisor “talked about kicking me out of the school when I had a temporary episode and was waiting to speak with my psychiatrist for a solution.” The student added that their interactions with the Office of Academic Success have “made me feel alone, singled out, and scared the entire time I have been here. I am constantly terrified that I will be kicked out for my condition if I have the slightest issue and am too afraid of discrimination to seek any help.”
Neurodivergent students may also experience bullying and harassment from peers at university. A student at University of Texas at Austin shared, “Usually I sit alone at the cafeteria. So I remember setting my tray down and then someone moved it as a joke. So literally I was freaking out until a whole group of people laughed at me. I was so embarrassed and I ate my food while I was crying. This was one of many things I’ve encountered for just being a loner and quiet.”
Police response to crisis: 100% of universities still rely on police to respond to students in crisis, despite that students have repeatedly informed administrations about the harms that these interactions cause. A former Resident Assistant (RA) at the University of Massachusetts Amherst told us that they were required to “call UMPD every time a student said they were thinking about hurting themselves.” In 2020, a Dartmouth student who was taken to the hospital by police for suicidal ideation, described the experience to the student newspaper as “very negative” and “scary,” expressing that it “felt very much like a punishment” (Kroitzsh 2020). A student at the College of William & Mary relates a similar experience, telling us, “I personally was taken from my dorm room by the police and forced to go to the counseling center. I missed classes and it did far more harm than good for my wellbeing.”
For multiply marginalized students, the risk of having any interactions with police, and the greater risk of being incarcerated or killed, can become a deterrent to seeking services, despite that they are often at greater risk for mental health disorders (Vargas, Huey, and Miranda 2020). A trans student at Case Western Reserve University tells us, “I have been offered a few resources to look into discrimination complaints at CWRU, however I’ve been too exhausted and depleted of survival resources while at this institution to even look into those follow ups… I was offered counseling through the school, they refused to address having to consent to police being available to call, even after situations like Jayland Walker in Akron happened, or I expressed the threat that comes with being trans. They refused to take action which made me abandon all counseling and mental health services through the school, as none could be honest.”
Following a lawsuit filed in 2018 over Stanford’s draconian leave policies for students in crisis (Kafka 2019), Stanford University students are now reportedly transported to the hospital by ambulance rather than Department of Public Safety (DPS) officers, though DPS still handles the initial response (Brubaker-Cole and Patel 2020). Similarly, on the University of Oregon website, Crisis and Community Support lists CAHOOTS (the mobile crisis unit) as an option, but the Report a Concern page on the Dean of Students’ website advises students to call the University of Oregon Police Department “if a current student poses a threat of harm to self or others.”
Update: The Daily Californian, the student newspaper of UC Berkeley, reported in September, 2023, that a new Campus Mobile Crisis Response team is set to be fully operational this year, with clinicians providing round-the-clock nonemergent care to the Berkeley community (Kwok 2023). It’s not clear yet if the team will be independent of UCPD, as currently they work in conjunction.
Students of Concern reporting: 55 of the 65 universities surveyed were using Students of Concern (SoC) or CARE reporting, which deputizes faculty, staff, students, and other members of the community to police student behaviors. A more recent survey indicates that both the number of campuses using SoC and the volume of reports submitted at every campus will increase into the foreseeable future as more universities adopt and inculcate these surveillance and reporting measures. According to a report by the student newspaper at Occidental College, “the number of Care Reports submitted by faculty has doubled from five years ago,” and faculty are now the most frequent category of reporter (Prakash 2023).
Unfortunately, universities seem to allocate more resources and attention to surveilling disabled students than responding to issues of sexual assault and harassment. At the University of Michigan, a student tells us that “The university doesn’t take sexual harassment and assault seriously, which is terrifying as a survivor and as a woman in general. I feel unsafe most of the time when I’m walking alone at night. When I tried to access campus mental health resources for immediate and pressing issues, the wait was over two months long.”
Pillar IV: Critical Pedagogy
Pillar IV measures the extent to which universities foster critical thinking about issues of power, capitalism, and race, and comprises four metrics. The first metric was a measure of a university’s support for racial justice, indicated by a university’s official statement of support for Black Lives Matter2 or Land Back. The second and third metrics indicate whether the university offers a Disability Studies program, and a course on Critical Theory, separately. The fourth metric is an indicator of a university’s commitment to ethical research. For each ethically dubious research program at a university, e.g. cure autism research, the university lost a quarter of its maximum points for this metric. This question had both multiple choice options and a text box for students to point out any research that they found troubling or questionable.
2 We are aware of concerns expressed by some members of the Black community about problems within the Black Lives Matter movement, and agree that this metric has become an unreliable measure of a university’s commitment to racial justice. For example, one student at Harvard, where the president did issue an official statement in support of “Black Lives Matter,” told us, “As a black student, my teachers, advisors, and residential tutors made it abundantly clear that I did not matter to them.”
The metrics for Pillar IV are grounded in the principles of disability justice, as conceived by Sins Invalid. It's important to acknowledge how disability discrimination can be compounded for people with multiply marginalized identities, including race, gender, sexual orientation, and national origin. More broadly, Pillar IV addresses questions about what the university is supposed to be, and what the university has become, especially in their relation to students, whom universities now view as total extensions of their profit-making machinery. Students who aren't profitable for universities are treated as disposable, and often worse, as threats and liabilities. This is why, as Jay Dolmage writes, "In the modern university, students with disabilities are kept far away from the discussions within which their input could be most illuminating, most challenging" (2017).
Scores for Pillar IV were normally distributed (Figure 8). Comparing mean scores on Pillar IV across regions, we observe that universities in the West scored highest (Mdn = 50.00, M = 47.12, SD = 21.89), followed by universities in the Northeast (Mdn = 43.75, M = 43.75, SD = 19.36), followed by universities in the Midwest (Mdn = 37.50, M = 36.16, SD = 11.01), and lastly, Southern universities (Mdn = 28.12, M = 32.39, SD = 18.36). Public universities (Mdn = 37.50, M = 39.49, SD = 20.52) outscored private universities (Mdn = 37.50, M = 37.80, SD = 14.45) nationally and in the Northeast and West (Figure 9).
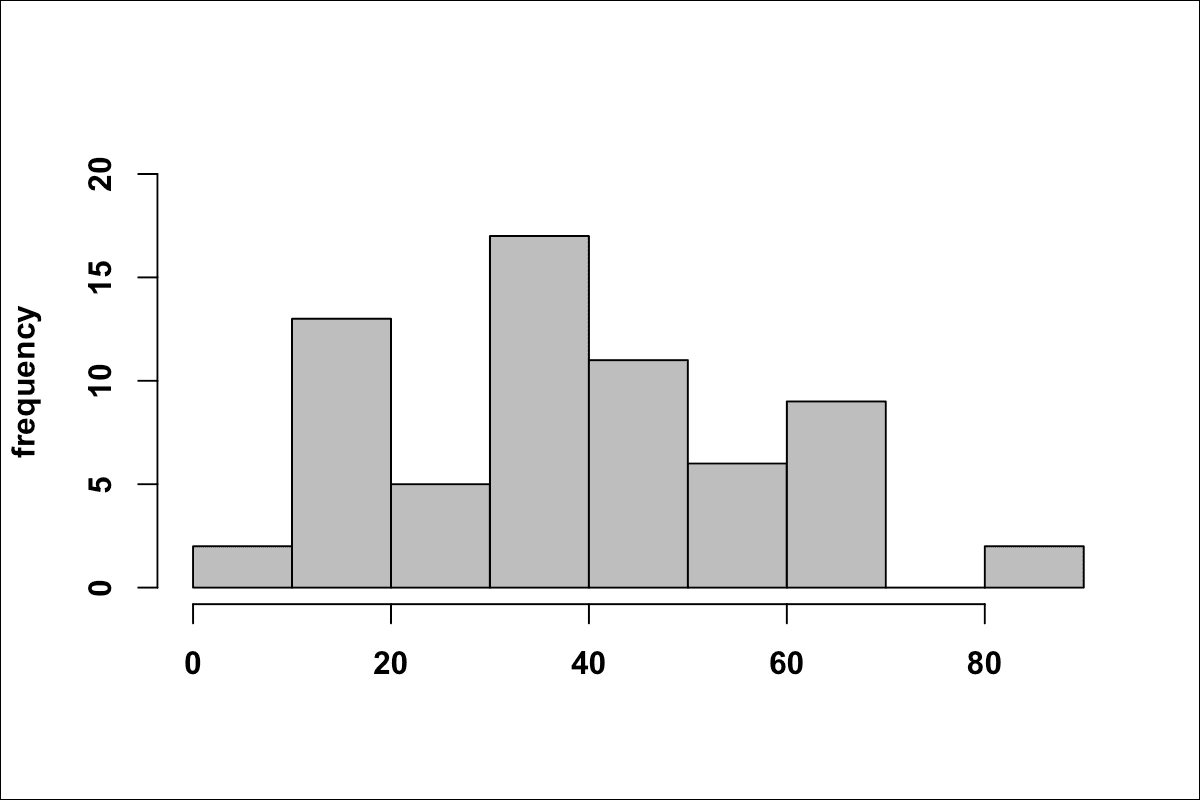
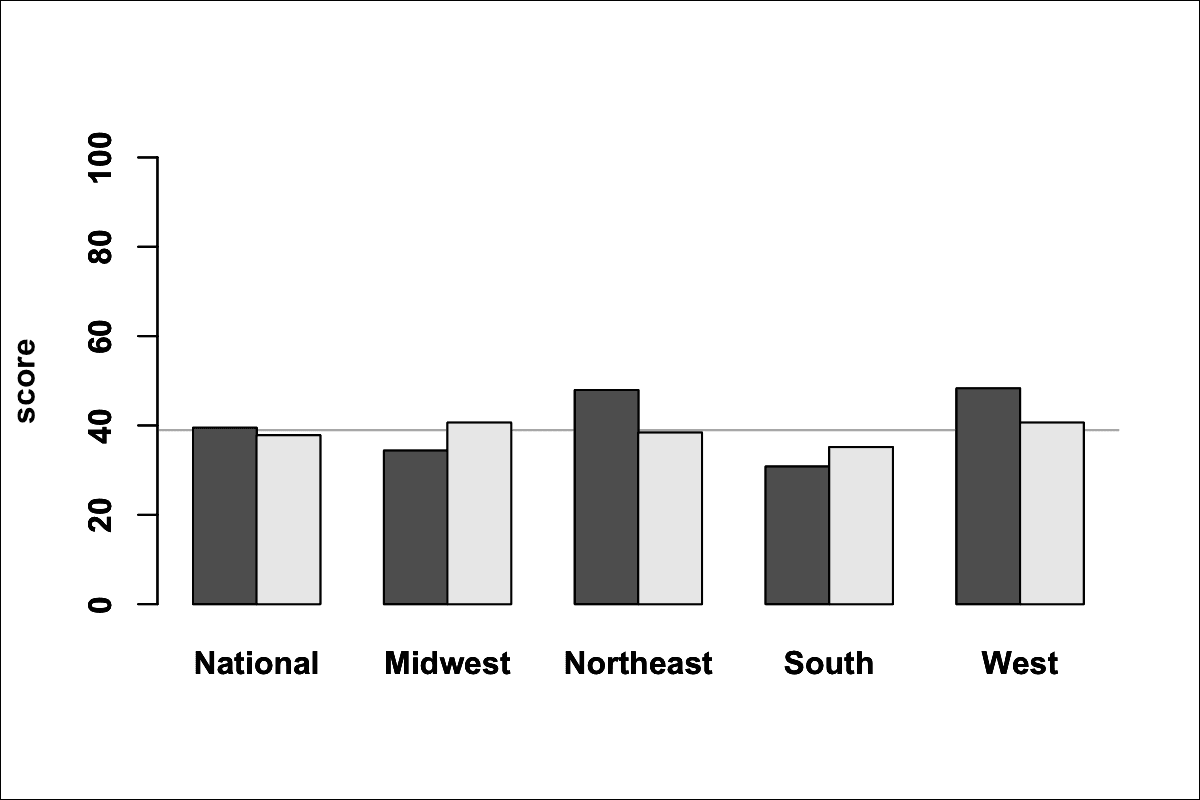
The average score for Pillar IV for all universities was 38.94 out of 100 (SD = 18.68), and the median was 37.50. The minimum score was 6.25 and the maximum was 81.25.
The universities that scored highest on Pillar IV were:
| 1 | University of Oregon | 81.25 | |
| 1 | University of Pittsburgh | 81.25 | |
| 3 | University of Colorado Boulder | 68.75 | |
| 3 | University of Washington-Seattle | 68.75 | |
| 5 | University of Idaho | 62.50 | |
| 5 | University of New Hampshire | 62.50 | |
| 5 | University of Arizona | 62.50 | |
| 5 | Rutgers University-New Brunswick | 62.50 | |
| 5 | University of Arkansas | 62.50 | |
| 5 | University of Kentucky | 62.50 | |
| 5 | Dartmouth College | 62.50 |
Support for racial justice: Twenty-one of the 65 universities surveyed issued statements in support of Black Lives Matter. Some respondents indicated that their universities sent emails in support of Black Lives Matter, and other students indicated that they had seen posters on campus. Because it was impossible to verify these statements, only universities that published official statements online were marked as supporting Black Lives Matter.
None of the universities surveyed issued statements in support of Land Back.
Disability Studies: Only two universities in this sample offer full-fledged Disability Studies programs: University of Kentucky and University of Washington-Seattle. However, seventeen of the universities surveyed offer minors or certificates in Disability Studies.
Update: UCLA began offering a BA in Disability Studies in the fall of 2023 (Wiesner 2023).
Critical Theory: 34 of the 65 universities surveyed offer courses in Critical Theory.
Ethical research: Only two of the universities surveyed (Rice University and University of Denver) were found not to be engaging in ethically dubious research.
Part of disability justice is recognizing our connections with other movements, including the struggles of non-human animals. As Leah Lakshmi Piepzna-Samarasinha wrote in Disability Visibility (2020), disability justice is about rejecting the divisions -- which are often a result of resource scarcity and competition due to working within the constraints of the nonprofit industrial/ foundation complex -- that keep our movements separated and weakened, because there is strength in solidarity. For this reason, any research that students wanted to call out and could be reasonably argued as unethical was acknowledged and included. For every school in the sample, we also checked if they did animal testing and also if they were listed in ProPublica’s Repatriation Project database as holding the remains of Indigenous Americans.
It's important that people not assume that the disabled community is a single-issue public, focused monolithically on only those issues that impact us directly. Disabled people have a long history of accompliceship, and of putting our body/minds on the front lines with other movements and struggles, including animal rights, and often at great risk to our own wellbeing and safety. Still, we're often invisibilized in these movements.
The best colleges
Giving each Pillar equal weight, we summed the four scores for each Pillar for each university and ranked them based on their totals. Out of a total possible score of 400 (100 for each Pillar), the ten universities with the highest scores were as follows:
| 1 | Harvard University | 136.25 | |
| 2 | University of Idaho | 135.83 | |
| 3 | The University of Chicago | 129.58 | |
| 3 | University of Wisconsin-Madison | 129.58 | |
| 5 | Dartmouth College | 127.50 | |
| 6 | Brown University | 123.33 | |
| 7 | University of Pittsburgh | 121.25 | |
| 8 | Columbia University | 114.58 | |
| 9 | University of Colorado Boulder | 112.92 | |
| 10 | University of Washington-Seattle | 109.58 |
Five of the top ten universities are located in the Northeast, three in the Midwest, and two in the Western United States. Four of the universities are members of the Ivy League. Five of the top ten universities are private and five are public universities.
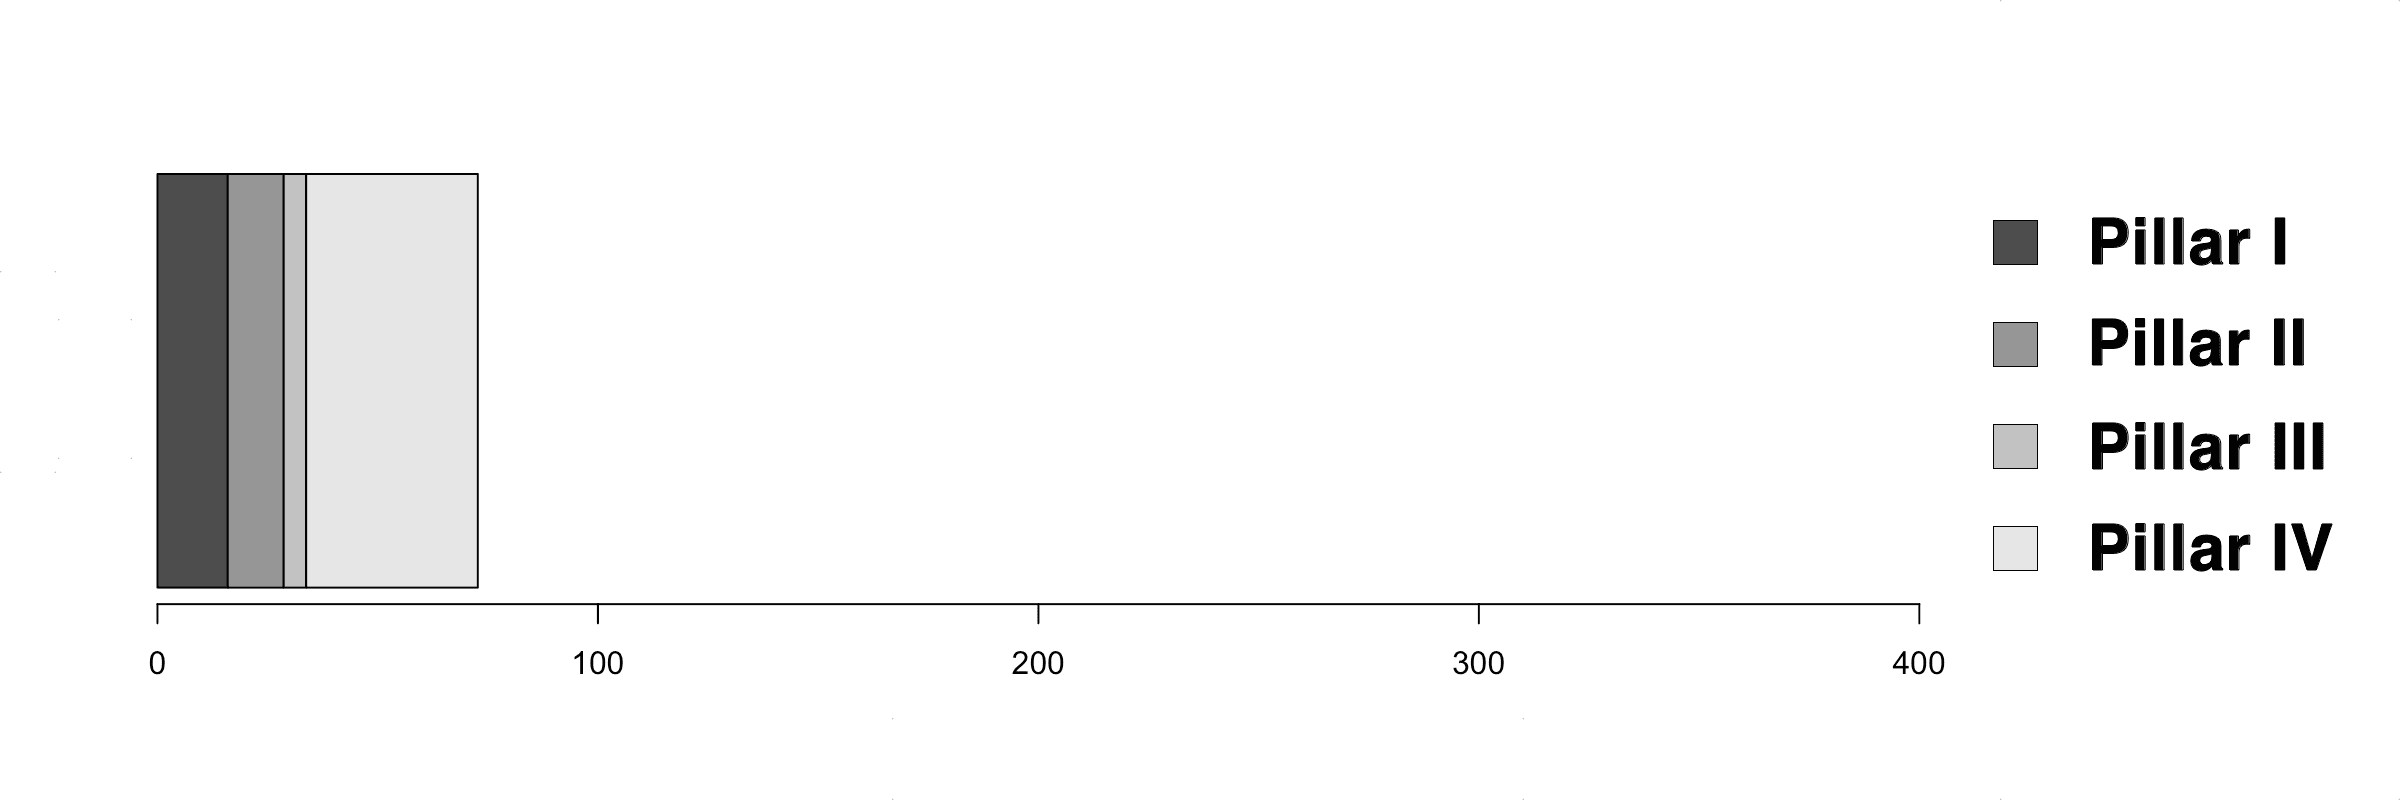
The national average total score was 72.74 out of 400, and no university scored higher than 35% of the total possible 400 points. The highest score in this sample (Harvard University, 136.25) is still only 34.06% of the possible maximum, but Harvard was the only institution to score above the national average on all four Pillars. Nationally, the mean scores on each of the four Pillars were 16.0 (SD = 10.4), 12.7 (SD = 17.6), 5.1 (SD = 12.1), and 38.9 (SD = 18.7), respectively. Comparing mean performance across the four Pillars, we observe that universities scored best on Pillar IV: critical pedagogy, and scored the worst on Pillar III: safety (Figure 10).
Conclusion
Though this and other recent analyses suggest that issues of accessibility and inclusion in higher education are finally receiving overdue attention, this analysis suggests many areas for improvement. For example, universities scored particularly poorly on Pillar III: safety. However, these metrics are not exhaustive in representing the many types of barriers and discriminations that disabled people experience in higher education, and more work needs to be done for scholarship to reflect the wide-ranging diversity of disabled students’ needs and experiences. As one student at University of California, Berkeley commented after completing this survey, “I would’ve hoped that the survey would’ve been more focused on the sense of belonging, general attitude towards the disabled, and quality of Disability services provided for disabled students.”
One of the challenges for this project and for disability advocacy generally is that disability comprises many different communities and people with widely divergent experiences and unfulfilled needs. Indeed, the reason that New Mobility designed its own college rating system was because its creators felt that wheelchair users were often “pushed down the ladder” in disability advocacy in higher education (New Mobility 2020). Similarly, in forming this project, we recognized an urgent need to foreground the voices of neurodivergent students in higher education, but also wanted to emphasize inter-disability solidarity. However, our attempts to collaborate with other disability advocates were often met with apathy, and some of the respondents to this survey also expressed dissatisfaction with the representativeness (or lack thereof) in the questions being asked. For example, a student at Columbia University provided feedback that, “This survey didn’t seem like it had much to do with my experience as a student with disabilities.”
As the results of this survey demonstrate, some colleges do well on certain metrics, but rarely excel on all. A student at the University of Illinois at Urbana–Champaign, which was New Mobility’s top-rated institution, told us that, “Throughout the last three years at my university I have personally experienced and witnessed many of my friends experience ableism from professors, as well as staff for those students who also work in the university. I have had college professors insist I am not disabled, as well as having to fight to get my accommodations respected. I have had teachers tell us we can do something with our future because ‘you’re all able bodied,’ which was not true and also implied that we wouldn’t have success if we were disabled. My disabled friends have returned from working in university buildings and said they were infantilized for their disabilities.” What this suggests is that no single research agenda may be adequate to reflect the diversity of disability in higher education.
As we mention in the Methods section of this report, the results of this study present an incomplete picture of disability in higher education. However, we think it made sense to start this work by focusing on the top ranked universities given that it's not uncommon for disabled students to be told by faculty, administrators, and advisors that they don't belong at these schools. This is, of course, not unintentional. These schools exclude many disabled students who would otherwise thrive, but don't have the perfect grades and records for admission that uphold the myth of meritocracy that is often a smokescreen for privilege. This gatekeeping and ableism contribute to a feedback loop by which there are fewer disabled students on these campuses to instigate these important conversations about disability and to fight for increased inclusion and representation for subsequent generations.
As calls for disability justice become more clarion and common on university campuses, which are often strongholds of enormous racial privilege and inequity, it is important to acknowledge and honor the original intent of the founders of disability justice, which is to center the voices of the most marginalized, particularly disabled Black people and disabled Indigenous people (Sins Invalid 2015). Hence, in addition to demanding that we interrogate disabled identity and ableism through an intersectional lens, disability justice requires that we examine our own participation in systems that exclude and harm other marginalized communities, including but not limited to higher education. As a Black student at Harvard explains, “Unfortunately, when I think of my personal, adverse experiences with Harvard University, racism comes to mind before ableism, although the organization has its fair share of both.”
Still, other students expressed bewilderment when encountering questions in this survey about racial justice at their schools. One student wrote in their feedback, “I don’t know why there is a question about the BLM movement for this type of survey.” These responses indicate that more work needs to be done to educate people on how ableism interacts with other forms of discrimination, including racism and ageism, and other identities, including gender and sexual orientation, race, color, and national origin. As a student at UCLA explains in their student newspaper, “An intersectional approach allows disabled students to learn more about their conditions from different perspectives, as people with the same disability might experience their condition in different ways” (Wiesner 2023).
With this work, we hope to have shed some light on the pervasive issues of ableism and inaccessibility in higher education. Contrary to the common misconception that disabled and neurodivergent students do not belong in academia, this analysis reveals that some of the most prestigious universities, including Harvard, are providing the most support for disabled students, although the results also suggest that all institutions of higher education can and must do better.
References
American Civil Liberties Union. Last updated December 21, 2023. “Mapping Attacks on LGBTQ Rights in U.S. State Legislatures.” Accessed December 21, 2023. https://www.aclu.org/legislative-attacks-on-lgbtq-rights.
Brubaker-Cole, Susie, and Bina P. Patel. 2020. “New Option for Transporting Students Who Are Experiencing a Mental Health Crisis.” Stanford Report, November 1, 2020. https://news.stanford.edu/report/2020/11/01/5150-holds/.
Center for Genetics and Society. 2022. “Forging New Disability Rights Narratives About Heritable Genome Editing.” Accessed December 21, 2023. https://www.geneticsandsociety.org/internal-content/forging-new-disability-rights-narratives-about-heritable-genome-editing.
The Chronicle of Higher Education. n.d. “The Assault on DEI.” Accessed December 21, 2023. https://www.chronicle.com/package/the-assault-on-dei.
Curiel, Mateo. 2022. “Dartmouth Student Government Brings Free and Unlimited Mental Health Counseling Access to Campus.” The Dartmouth, October 6, 2022. https://www.thedartmouth.com/article/2022/10/dartmouth-student-government-brings-free-and-unlimited-mental-health-counseling-access-to-campus.
Dolmage, Jay T. Academic Ableism. Ann Arbor: University of Michigan Press, 2017.
Freeman, Lily. 2023. “New ASUCD Survey Aims to Gauge Undergraduate Opinions on Mandatory Lecture Recordings.” The California Aggie, October 26, 2023. https://theaggie.org/2023/10/26/new-asucd-survey-aims-to-gauge-undergraduate-opinions-on-mandatory-lecture-recordings/.
Gabelnick, Hannah. 2023. “University Considers Extending Time Between Classes for Easier Commutes, Sustainable Schedules.” The Daily Princetonian, October 23, 2023. https://www.dailyprincetonian.com/article/2023/10/princeton-news-adpol-dean-college-extending-passing-time-remodeling-deans-date.
Gaylord, Soleil, and Arielle Feuerstein. 2021. “Dartmouth Mental Health Resources Prove Insufficient to Manage Rise in Mental Health Struggles.” The Dartmouth, July 16, 2021. https://www.thedartmouth.com/article/2021/07/dartmouth-mental-health-resources-prove-insufficient-to-manage-rise-in-mental-health-struggles.
Heyman, Miriam. 2018. The Ruderman White Paper on Mental Health in the Ivy League. Newton: Ruderman Family Foundation. https://rudermanfoundation.org/white_papers/the-ruderman-white-paper-reveals-ivy-league-schools-fail-students-with-mental-illness/.
Hirsch, Drew. 2023. “Op-ed: UCLA Lacks Accommodations for Students Who Need Sensory-Friendly Spaces on Campus.” The Daily Bruin, October 8, 2023. https://dailybruin.com/2023/10/08/op-ed-ucla-lacks-accommodations-for-students-who-need-sensory-friendly-spaces-on-campus.
Huang, Elaine, and Suthi Navaratnam-Tomayko. 2023. “How Accessible is Princeton’s Campus? We Broke It Down.” The Daily Princetonian, March 28, 2023. https://www.dailyprincetonian.com/article/2023/03/princeton-dorms-buildings-campus-accessibility.
Johns Hopkins Disability Health Research Center. 2021. “The Johns Hopkins Disability Health Research Center University Disability Inclusion Dashboard.” Accessed December 21, 2023. https://disabilityhealth.jhu.edu/inclusiondashboard/.
Kafka, Alexander C. 2019. “Stanford’s New Policy for Student Mental-Health Crises Is Hailed as a Model.” The Chronicle of Higher Education, October 10, 2019. https://www.chronicle.com/article/stanfords-new-policy-for-student-mental-health-crises-is-hailed-as-a-model/.
Kroitzsh, Aleka. 2020. “‘It Felt Very Much Like a Punishment’: Medical Leave at Dartmouth.” The Dartmouth, February 7, 2020. https://www.thedartmouth.com/article/2020/02/it-felt-very-much-like-a-punishment-medical-leave-at-dartmouth.
Kwok, Hugo. 2023. “‘Campus Mobile Crisis Response Team’ Seeks to Provide Nonemergent Mental Health Care.” The Daily Californian, September 18, 2023. https://prod.dailycal.org/2023/09/18/campus-mobile-crisis-response-team-seeks-to-provide-nonemergent-mental-health-care.
Lakshmi Piepzna-Samarasinha, Leah. "Still Dreaming Wild Disability Justice Dreams at the End of the World." In Disability Visibility, edited by Alice Wong, 250-61. New York: Vintage Books, 2020.
Ling, Sophia. 2021. “Dear President Fenves, Here’s What You Need to Know About Mental Health.” The Emory Wheel, December 1, 2021. https://emorywheel.com/dear-president-fenves-heres-what-you-need-to-know-about-mental-health/.
Milkowski, Gray. 2022. “‘Access, Awareness, Prevention, and Support.’ Harvard Moves to Implement Student Mental Health Task Force Recommendations.” The Harvard Gazette, October 6, 2022. https://news.harvard.edu/gazette/story/2022/10/harvard-moves-to-implement-recommendations-for-student-mental-health/.
Mouly, Maxine. 2022. “‘You Don’t Look Disabled’: UC Berkeley Students with Disabilities Grapple with Being Seen, Understood.” The Daily Californian, January 26, 2022. https://prod.dailycal.org/2022/01/26/you-dont-look-disabled-uc-berkeley-students-with-disabilities-grapple-with-being-seen-understood.
New Mobility. 2020. “College Guide Webinar.” Accessed December 21, 2023. https://vimeo.com/481890021.
New Mobility. 2020. “‘Wheels on Campus’ Profiles Top 20 Wheelchair-Friendly Colleges.” Accessed December 21, 2023. https://newmobility.com/wheels-on-campus-profiles-top-20-wheelchair-friendly-colleges/.
Petersen, Kole. 2023. “The Underrepresentation and Misrepresentation of Disabilities in Media.” The Catalyst, November 30, 2023. https://thecatalystnews.com/2023/11/29/the-underrepresentation-and-misrepresentation-of-disabilities-in-media/.
Prakash, Divya. 2023. “Everyone’s Talking about Mental Health on Campuses and ‘Oxy Is No Exception.’” The Occidental, March 8, 2023. https://theoccidentalnews.com/features/2023/03/08/everyones-talking-about-mental-health-on-campuses-and-oxy-is-no-exception/2908421.
Reilly, Liv, and Elizabeth Egan. 2023. “‘No Body or Mind Left Behind’: The 32-Hour Fight for Accessibility at UNC.” The Daily Tar Heel, March 1, 2023. https://www.dailytarheel.com/article/2023/03/university-accessibility-activism-south-building.
Rossi, Andrew. 2014. “How American Universities Turned into Corporations.” Time, May 22, 2014. https://time.com/108311/how-american-universities-are-ripping-off-your-education/.
Sins Invalid. 2015. “10 Principles of Disability Justice.” Accessed December 21, 2023. https://www.sinsinvalid.org/blog/10-principles-of-disability-justice.
UCLA School of Law. n.d. “CRT Forward.” Accessed December 21, 2023. https://crtforward.law.ucla.edu/.
Vargas, Sylvanna M., Stanley J. Huey, and Jeanne Miranda. “A Critical Review of Current Evidence on Multiple Types of Discrimination and Mental Health.” American Journal of Orthopsychiatry 90, no. 3 (2020): 374-90. https://doi.org/10.1037/ort0000441.
Wiesner, Callie. 2023. “UCLA Launches New Bachelor of Arts Degree in Disability Studies.” The Daily Bruin, November 12, 2023. https://dailybruin.com/2023/11/12/ucla-launches-new-bachelor-of-arts-degree-in-disability-studies.
Wong, Alice. Disability Visibility. New York: Vintage Books, 2020.
Young, Hayley. 2023. “Georgetown Establishes New Disability Cultural Center.” The Hoya, September 14, 2023. https://thehoya.com/georgetown-establishes-new-disability-cultural-center/.